Resource:Performancebrowser
Introduction
Performance browser is used to monitor the performance of resources on the server. Specifically, it shows how much CPU time and memory each resource is consuming. It is useful for finding out which resources are slow, and which ones are leaking memory.
Web access
To allow access to the performance browser web interface, add an ACL which includes rights to 'resource.performancebrowser.http' and 'resource.ajax.http'. The server default ACL now comes with a "DevGroup" and "DevACL" specifically for this purpose. If your servers ACL does not have them, here is the acl.xml extract:
   <group name="DevGroup">
      <acl name="DevACL"/>
   </group>
   <acl name="DevACL">
        <right name="resource.performancebrowser.http" access="true"></right>
        <right name="resource.ajax.http" access="true"></right>
   </acl>
Then all you have to do is add users to the "DevGroup" and use this URL in a browser: http://SERVER_IP:HTTP_PORT/performancebrowser/ On localhost it would look something like this: http://localhost:22005/performancebrowser/. So, turns out the default HTTP port is 22005.
In game access
There is also an in-game version of the performance browser called 'ipb' which is now part of the official server resources. If you don't have it, it can be found in the latest resources zip: http://mirror.mtasa.com/mtasa/resources/
To access the IPB, log in to an account with access to admin permissions then use the command /ipb.
Category - Event Packet usage
Select Event Packet usage from the Category drop down to view details about triggerClientEvent and outgoing setElementData packet usage.
The main columns are:
- Type - How the packets are created. This can be one or more of:
- ElementData - Caused by server side setElementData
- ElementData(Relay) - Caused by client side setElementData
- Event - Caused by server side triggerClientEvent
- Name - The name used in the script
- pkt/sec - The number of messages per second generated.
The '5 sec' columns are:
- pkts - The number of messages generated in the last 5 seconds
Category - Server info
Select Server info from the Category drop down to view summary info for the server.
Logic/Sync/Raknet/DB thread CPU %
Shows the % of total available CPU used by various server threads:
- Logic thread - is the one that does the Lua scripts etc.
- Sync thread - makes sure the sync looks nice and smooth, even when the logic thread is maxed out.
- Raknet thread - handles the sending and receiving of networks packets to/from the connected clients.
- DB thread - is for database stuff.
The total % available for MTA depends on the number of CPU cores available. If MTA has access to 4 CPU cores, then the max CPU available in total is 400%, (although each individual thread cannot go above 100%). If a Sys: amount is shown, this is additional % used by the system (O/S) for doing it's job.
- Example:
- Logic thread CPU: %30 (Sys:4%)
- Sync thread CPU: %20
- Raknet thread CPU: %42 (Sys:14%)
- DB thread CPU: %0
- Total CPU % consumed is 30+4 + 20 + 42+14 = 110%, and if that is on a 4 core machine, then divide by 4 to get overall usage. 110/4 = 27.5%
Category - Lua timings
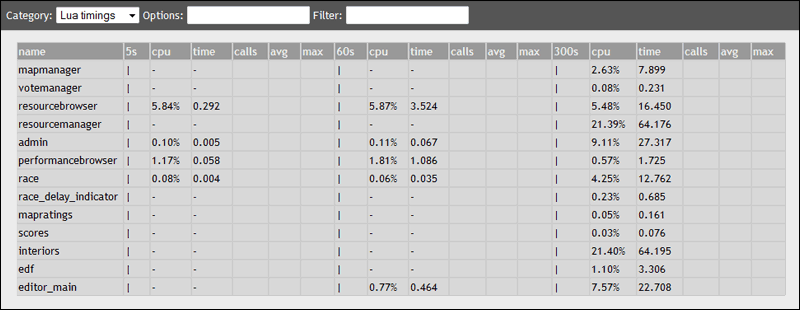
Select Lua timings from the Category drop down to view timing information for each resource:
By default, there are three blocks of columns, each one representing a different sample period. In the picture below, block A represents samples taken in the last 5 seconds, block B represents samples taken in the last 60 seconds, and block C represents samples taken in the last 300 seconds.
The columns in each block are:
- name - Name of the resource
- cpu - Amount of CPU time taken (in percent)
- time - Amount of CPU time taken (in seconds)
- calls - The number of times the function was called
- avg - The average time spent in the function
- max - The maximum time spent in the function
Note: To keep the display as clear as possible, anything that has taken less than 0.01% of CPU time is not be displayed.
Options
Use the d option to display the timings for specific events and functions in the resource. If a function name cannot be determined, it will display the @ sign followed by the file name and line number the function starts. You can then locate that function by looking in the source file.
Use the 5, 60, 300 and 3600 options to select what sample periods to show. For example, the option string 5,60,300,3600 will show all 4 sample periods. (If no sample periods are chosen, the default of 5,60,300 is used.)
Use the Filter setting to view a smaller range of resources.
Category - Lua memory
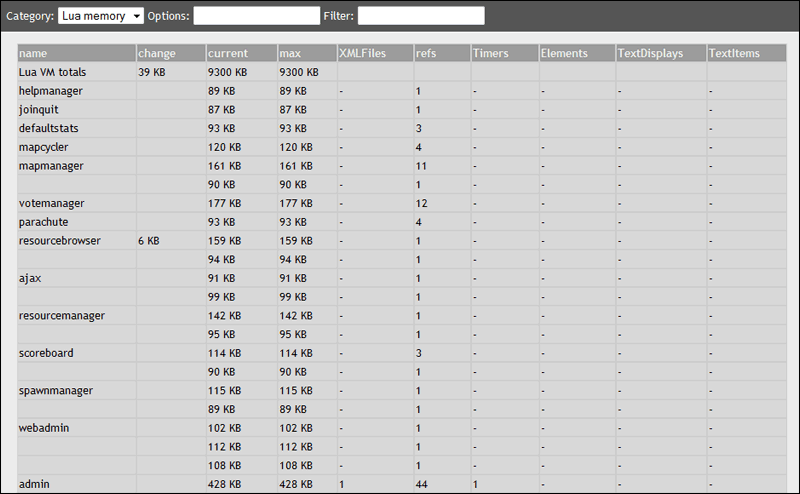
Select Lua memory from the Category drop down to view memory consumption of each Lua resource:
The columns are:
- name - Name of the resource
- change - The change in memory use since the last refresh
- current - The amount of memory the resource is using now
- max - The most memory the resource has ever used
- XMLFiles - The number of open XML files
- refs - The number of callback functions
- Timers - The number of active Timers
- Elements - The number of Elements
- TextDisplays - The number of Text Displays
- TextItems - The number of Text Items
Options
Use the a option to show more accurate memory usage. Note: This calls the Lua garbage collector before each refresh, which could slightly reduce server performance.
Use the Filter setting to view a smaller range of resources:
Category - Lib memory
Select Lib memory from the Category drop down to view memory consumption of the appropriate library (.dll or .so)
Note: This information is only available if the library has been compiled with WITH_ALLOC_TRACKING set to 1
The columns are:
- name - Name of the library
- change - The change in memory use since the last refresh
- current - The amount of memory the library is using now
- max - The most memory the library has ever used
Options
Use the i option to show more information:


